Roamler manages more than bringing together supply and demand through a platform. We are able to handle the complete process from A to Z; from receiving specific requests and executing them, to giving transparent and real-time insight into the process and results. Our platform technology gives you full-width knowledge about your day-to-day field operations, offering you a smart advantage to your competitors.
Considering the uniqueness of our model, we understand that it might raise certain questions. Especially when it comes to the way we give insight into the results and performed work by our community of professionals. That is why, in this article, we dive into Roamler’s way of reporting back to our customers, by giving you an answer to the Frequently Asked Question “How do we – as customers – get insight into the performed work and results?”.
Retail
Through our retail division, businesses can leverage a community of trained shoppers across Europe. Thanks to Roamler’s mobile app technology, these shoppers can submit location-specific data and photos, enabling us to provide you with relevant insights through our (1) customer portal and (2) custom-built reports.
- Customer portal
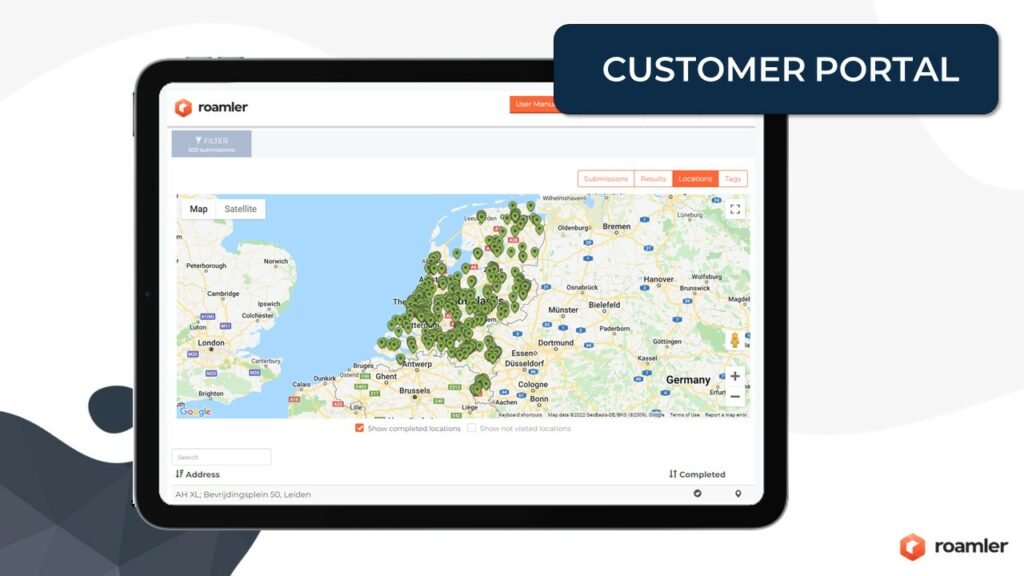
Every customer that starts a project with our retail department gets credentials to our customer portal. In our customer portal, you can find real-time, interactive data about the field tasks performed within your project, aligned with your established KPIs. Ranging from detailed submissions to overall results, you can dive into more specific cases, as well as oversee average figures about the situation on the shop floor in graphs and tables. For an outlook on all visited and unvisited locations, the customer portal is your go-to source, but in case you would prefer diving into the raw data yourself, an excel file with all data is available through a download in the portal as well.
- Custom reports
In case even more in-depth insight into shop floor data is required for your retail project, our teams of Customer Success Managers and Data Analysts can create clear and playful reports in data tooling such as PowerBi. These reports make it easier to create actionable plans based on the gathered data over multiple projects and are especially useful for more complex or long-term monitoring projects. Based on these reports, you can draw data-driven conclusions, make forecasts, and advise on short and long-term actions at SKU-, brand-, or category level. Besides PowerBI data dashboards, our operations teams can offer other reports, such as in-store photo overviews, or PowerPoint decks.
Tech solutions
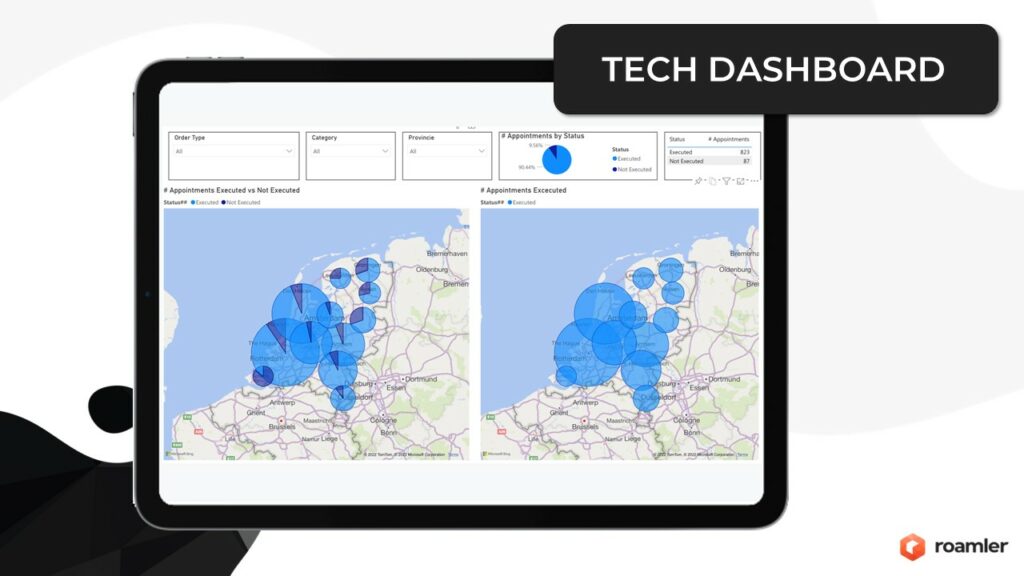
Through Roamler’s Tech department, location-based technical installations-, repairs-, and maintenance tasks are offered to an open community of self-employed technicians. As the community of tech professionals submits location-specific information and photos through the advanced Roamler app, we can provide you with the valuable data you need. This way of working enables you to continually monitor your technical field operations, and to adopt specific, steering actions in a timely manner if needed.
Depending on your KPIs, one of our Customer Success Managers or data analysts creates a customised dashboard using the incoming data. These dashboards give you a broad range of information, such as the number of technical tasks performed within a certain timeframe, and the specific locations that still need to be visited. According to your needs, your dedicated Customer Success Manager will meet you and your team on a weekly basis for more detailed information on that week’s executed tasks, or on a monthly or quarterly basis for more general overviews of the overall performances.
Care solutions
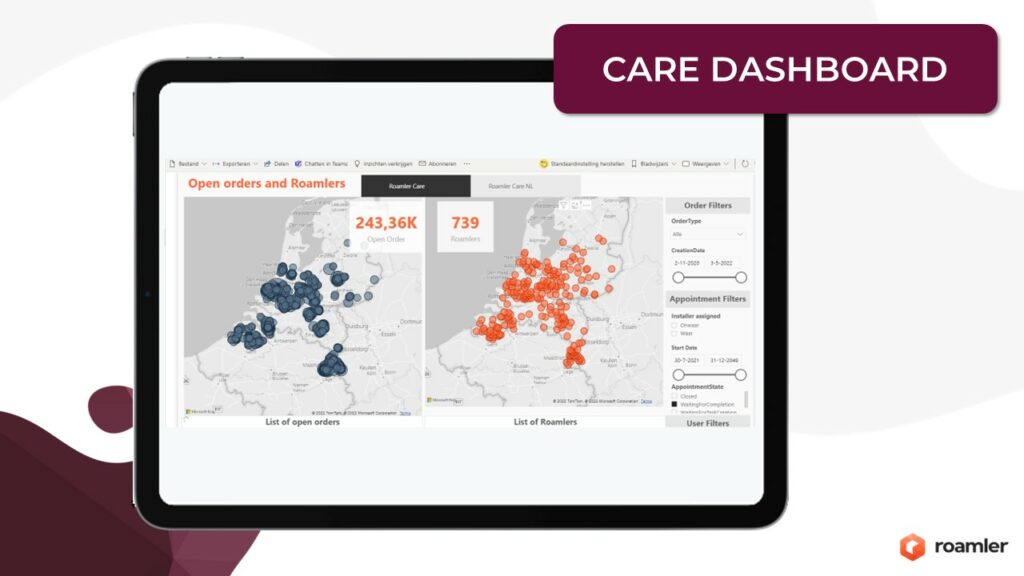
Through Roamler’s Care department, location-based healthcare tasks are offered to an open community of self-employed caregivers. These on-demand caregivers use the Roamler mobile app to submit task-specific information after their visit, allowing us to give care organisations relevant insight into the performed care activities and the locations visited.
Using the submitted data by the community of care givers, our Data Analysts create custom client dashboards. Given that healthcare organisations working with Roamler differ greatly in terms of size and demand, these dashboards are tailored to each client’s needs. They could be focused on, for example, financial insights such as the overall earnings by the flexible care givers, or the number of tasks that were executed by them. Another possible angle is an overview of the already executed tasks ánd the available tasks that can still be picked up by the community of flexible care givers (see below). All in all, a useful and collaborative way of monitoring the day-to-day operations between care organisations and Roamler.